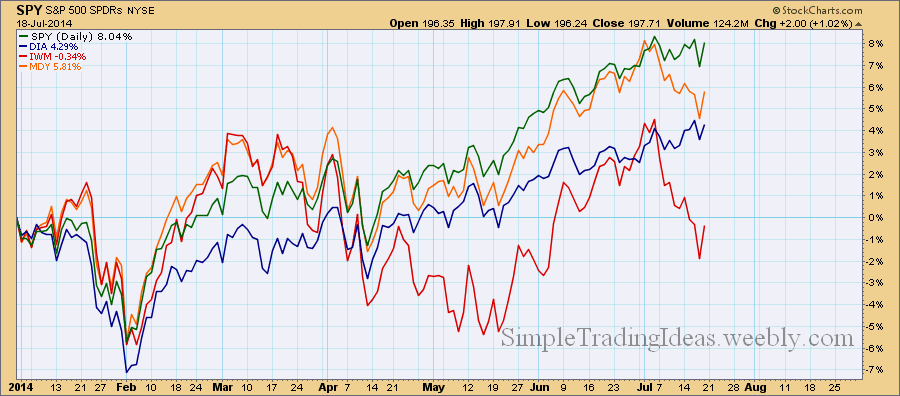
The performance chart below compares four ETFs representing the Mega-Caps, Large-Caps, Mid-Caps and Small-Caps. Large-Caps are the best and the Meg-Caps are trying to catch up. On the other hand Small-Caps are not doing so good.
| Simple Trading Ideas |
|
|
The performance chart below compares four ETFs representing the Mega-Caps, Large-Caps, Mid-Caps and Small-Caps. Large-Caps are the best and the Meg-Caps are trying to catch up. On the other hand Small-Caps are not doing so good.
0 Comments
If you read my last couple of posts than you know that it wasn’t a surprise that the market moved lower during this week. This is of course not the end of the World but the way I see it the correction is not over yet. Next week we will possible see further decline. Corrections like this give a good opportunity to trade volatility, namely VIX. You can’t trade directly VIX but there are plenty of VIX derivatives available. The easiest thing is to buy VIX calls during a market decline. There were good entry points last week, now probably it would be too late. Good timing is almost always the most important part of a good trade. If you are in a VIX trade, don’t get too greedy, realistically set resistance levels. The daily chart below shows SPY with MACD and StochRSI indicators. Both indicators show a bearish bias. From the chart below it looks like the correction could take another week and a half. The Februaty low or the 200-day MA could be a support or maybe both. 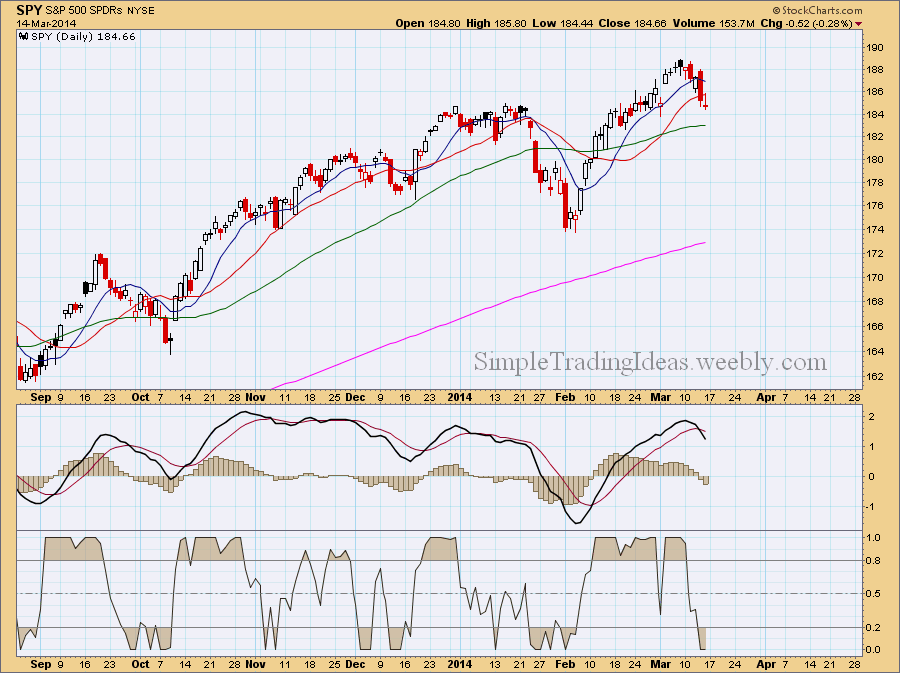 The chart below shows the daily chart for $VIX, the volatility index with the Aroon indicator below the chart. Aroon-Up (green) is in the 70-100 range and Aroon-Down (red) is below 50. This tells us that $VIX is in an uptrend. That's is bearish for the Market. 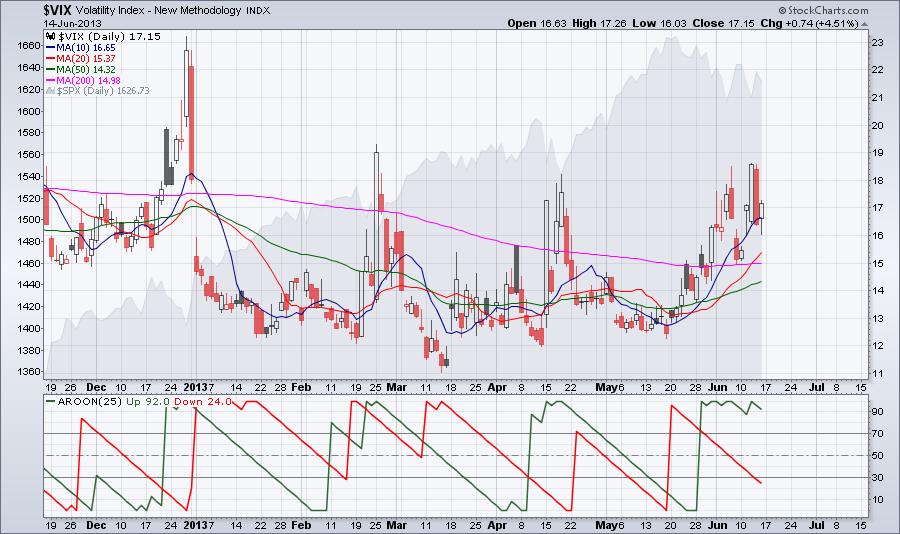
This is the second weekest sector after the utilities sector. XLP fell below its 50-day MA with heavy volume.  VIX the "fear gage" spiked up today as the market moved lower. This could be the sign of a pullback or the start of a correction. 
The Stochastic Oscillator is a momentum indicator which tracks the current location relative to the high-low range in a set number of periods. As a momentum indicator it changes direction before price. The Stochastic Oscillator is calculated as follows: %K = (Current Close - Lowest Low)/(Highest High - Lowest Low) * 100 The StochRSI is the Stochastic calculation applied to RSI. This makes StochRSI an indicator of an indicator. The calculation is the following: StochRSI = (RSI - Lowest Low RSI) / (Highest High RSI - Lowest Low RSI) StochRSI moves between 0 and 1. This momentum indicator can be used to identify trends, trend reversals, oversold and overbought conditions. The chart below shows the weekly chart for SPY with StochRSI. As you can see StochRSI moved to 0 but the 5 period EMA of StochRSI is still above 0.5. When in previous instances SPY moved to 0 it signaled the beginning of a medium-term correction. Also notice heavier selling volume. 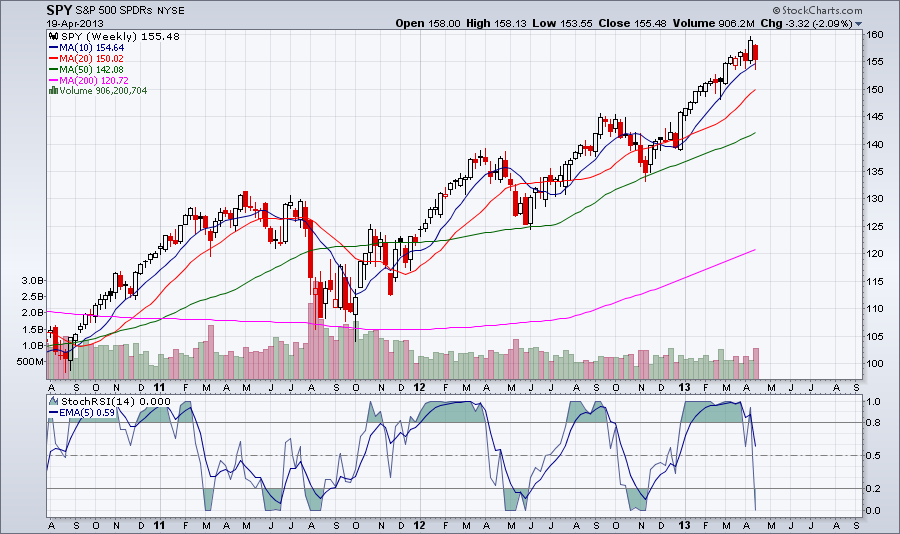
Securities don't trend all the time. If they would, investing in securities would be the easiest thing to do. In an uptrend when prices move up it gains momentum, more and more buyers participate. Buyers become optimistic and demand exceeds supply driving prices even further up. When this happens, prices move away from they longer term averages. This can be seen on a chart adding moving averages. The moving averages sort of fan out and they don't run parallel anymore. How long can it be sustained? At some point momentum start to fade. Some of the buyers are not willing to pay higher prices or don't buy at all being afraid that prices will reach their limit soon. At this point not only momentum indicators but other indicators show that the trend might be exhausted. This could happen in any time frame. This is the end of an uptrend followed by a consolidation or correction when prices revert back to their mean value. When this happens, the moving averages are getting closer again. The shorter moving averages even cross below the longer moving averages. In a healthy uptrend this mean reversion doesn't last long proportionally to the cycle. The moving average ribbon chart below shows how the moving averages "behave" in an uptrend and during a correction when mean reversion takes place. 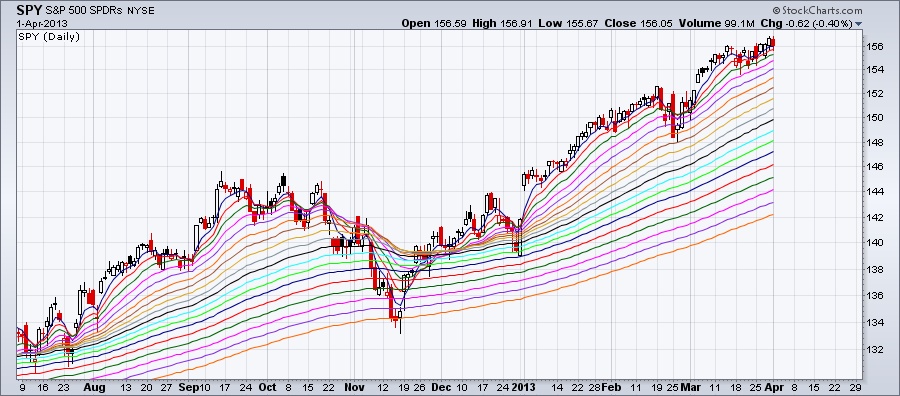
|
Loading
Search Site
Links
Archives
September 2014
Categories
All

|
 RSS Feed
